Geoscience INTEGRATOR
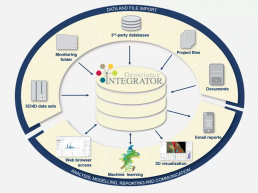
Geoscience INTEGRATOR was designed for data management, 3D visualization and query. It also allows analysis for integration of 3D mineral exploration and 4D geotechnical engineering data, interpretation, files, and documents.
We bring together true 4D multi-disciplinary data management, modelling, query, and expert-system analysis to forecast the geotechnical hazards quantitatively for design or real-time monitoring applications.
Mira Geoscience
Structured and Unstructured Geoscience data and interpretation, including drillholes and all types of geological, geophysical, geochemical, and geotechnical data and models, are brought together under Geoscience INTEGRATOR. It tracks both space and time and is fully 4D. It is possible to store, manage documents and files and to link them to data and interpretation. It also supports metadata, tags, reporting, and internal advanced spatial computation.
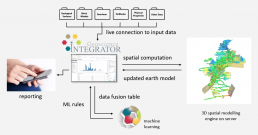
The system provides a data fusion capability specifically aimed at mining industry challenges. It does this by maintaining 3D earth model and 4D mine model geometrical data structures, upon which the multiple data sets can be projected, interpolated, upscaled, downscaled, or processed appropriately for each data type so that variables of importance can be co-located in space and time. This is a requirement for application of analytics or machine learning.
Customized links to our powerful 3D viewer Geoscience ANALYST provide a strong visual and quantitative link between data and model. Embedded Business Intelligence functionality provides access to a range of charts, tables, and other data views. Standard data import functionality may be augmented by the creation of customized links to any data source, including real-time data feeds.
4D data management, query, and visualization
Data from multiple exploration projects and mine sites can be managed by each Geoscience INTEGRATOR server. This is valid for an unlimited number of users, and through both a web interface and Geoscience ANALYST, providing overview dashboards of data sets, metadata, statistics, and links to documents and files. It is possible to query data interactively in 2D, 3D, and 4D through spatial, temporal, and record-values. Historical data can be easily discovered, visualized, and downloaded.
- Data sets managed as user-defined, structured tables of records or as files with metadata.
- Data formats are free-form, using user-established templates containing any number of fields. Data may be integer, float, binary, classification, alphanumeric, or date/time. Time variance is supported on all data types for which it makes sense.
- Document and file manager with extensive metadata.
- Automated data import with quality control using user-defined rules.
- Web interface and Geoscience ANALYST 3D viewer provide an overview dashboard of data sets, metadata, statistics, and links to documents and files.
- Select data by type, name, time range, spatial extents and many other attributes.
- User tags, customized metadata, links among data, files, and documents, and 3D polygon search all support complex query capability to quickly identify data of interest.
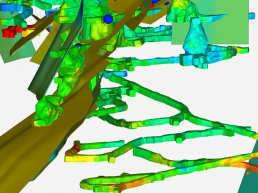
- 3D visualization of most geoscience data types, including automated import of many standard file types; linked 2D, 3D, and tabular data views.
- Access to tools that work with the 3D visualizer, for example digitization, simple surface creation, live links to Maxwell and ioGAS, and geophysical tools.
Data fusion for machine learning
Applying machine learning requires data fusion. When assessing geotechnical hazard, mine engineers know that rock burst hazard, for example, depends on geology, stress, production factors, rock mass quality, seismicity, and other variables, yet quantitatively integrating them has been a challenge to date. Another example is mineral exploration, where geological and geophysical data are often overlaid and interpreted together by knowledgeable explorers, but this falls short of the quantitative data fusion to which machine learning can be applied.
- Automated compilation of all data records by sample number, enabling instant correlation of multiple variables measured on the same sample at different times or by different labs.
- The “mine model” is a 4D data structure for automatically co-locating multiple variables of interest in space and time. A multitude of variables related to geology, structure, stress, mine infrastructure, geometry, and production can be upscaled, downscaled, interpolated, and projected into (x, y, z, t) representations that are aligned in space and time. The mine model is suitable as input to both unsupervised and supervised machine learning.
- The “earth model” is like the mine model, typically reduced to 2D or 3D as time-dependent variables are less common than at a mine site. A multitude of variables related to geology, structure, geochemistry, geophysics, and physical properties can be upscaled, downscaled, interpolated, and projected into representations suitable as input to both unsupervised and supervised machine learning for exploration targeting or related applications such as geometallurgical characterization.
Geotechnical hazard assessment
It is possible to apply knowledge-based and machine learning rules anytime or on an automatic schedule, typically connected to import of new data. For example, if seismicity data is automatically imported and the mine model data fusion structures updated daily, the hazard assessment can also be automatically updated daily.
Our premise is simple, and it’s proven effective over a wide variety of mine types, e.g. open pit, underground, hard rock, soft rock and hazard types (roof fall, slope failure, water inflow). Hazard is modelled as a 4D function of time and space on the rock interface where the hazards are experienced, typically related to dozens of variables compiled using Geoscience INTEGRATOR’s data fusion functions. Machine learning methods are used to examine the history of the state of the mine over time, compare it to the history of geohazards, and to rigorously explore the relationships in order to define the data-driven hazard equation.
- New data is automatically imported through a “monitoring folder” system that detects new input files made available by third-party systems or site personnel, or automatically pulled from third-party databases using customized links.
- On import of new data, appropriate processing is used to upscale, downscale, interpolate, and project data as required to update the mine model. A scriptable version of the core GOCAD Mining Suite run-time engine on the Geoscience INTEGRATOR server is used to carry out 3D spatial and property computations of any required complexity. For geotechnical hazard assessment this includes functions such as onboard seismic data processing, kinematic bench analysis, and 3D interpolation of structural data.
Knowledge-based and machine learning rules can be applied anytime or on an automatic schedule, typically connected to import of new data. For example, if seismicity data is automatically imported and the mine model data fusion structures updated daily, the hazard assessment can also be automatically updated daily.
Hazard reports can be automatically generated and distributed to a defined email group on a user-defined schedule. Hazards above a given threshold are highlighted.
Analytics and reporting
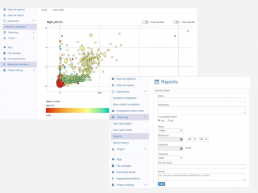
A range of charts, tables, and other data views can be accessed in the web browser thanks to Embedded Business Intelligence functionality. Reports containing most charts and tables can be compiled into a customizable PDF report for ad hoc or scheduled delivery. The 3D visualizer (Geoscience ANALYST) provides linked 2D, 3D, tabular, and statistical data displays.
- Histograms, scatter plots, ternary diagrams, time series.
- Fine-grained control over plotting parameters including linear and log displays, point scaling and colouring by other properties, and tool tips.
- Fine-grained query filters control record selection on all plots and tabular displays.
- “Mine model” data fusion table and 2D map view plot, selectable by mine elevation, coloured by any desired property.
- Export tables to csv.
- Chart and table views with all applied plotting parameters and query filters can be saved as reports for later viewing with updated data.
- Chart, table, and mine model views can be inserted into PDF reports for ad hoc or scheduled distribution to defined email groups.
- Geoscience ANALYST provides linked 2D, 3D, tabular, and statistical data displays of the Geoscience INTEGRATOR database.